Vera Vogel · 23 October 2026
Corporate Wellness Dashboards Reveal Connections Between Peer Encouragement Cycles and Retention in Distributed Tech Teams
Corporate wellness dashboards have emerged as central tools for monitoring structured peer encouragement cycles, which consist of organized sequences where team members exchange targeted support messages, recognition notes, and collaborative check-ins on set schedules, and these systems now link participation levels directly to retention outcomes in distributed tech teams spread across multiple time zones and regions.
Defining Structured Peer Encouragement Cycles
Structured peer encouragement cycles operate through recurring intervals, often weekly or biweekly, where participants receive prompts via integrated platforms to offer specific forms of encouragement such as milestone acknowledgments or problem-solving suggestions, while the process logs response rates and interaction depth without requiring managerial oversight at every step, and companies deploy these cycles to build connections among remote workers who lack daily in-person contact.
Tech organizations began scaling these cycles around 2023 as hybrid work patterns solidified, with cycles typically lasting four to six weeks before rotating participants to maintain freshness, and dashboards capture variables including cycle completion percentages, average response times, and sentiment scores derived from text analysis tools.
How Dashboards Integrate and Analyze Data
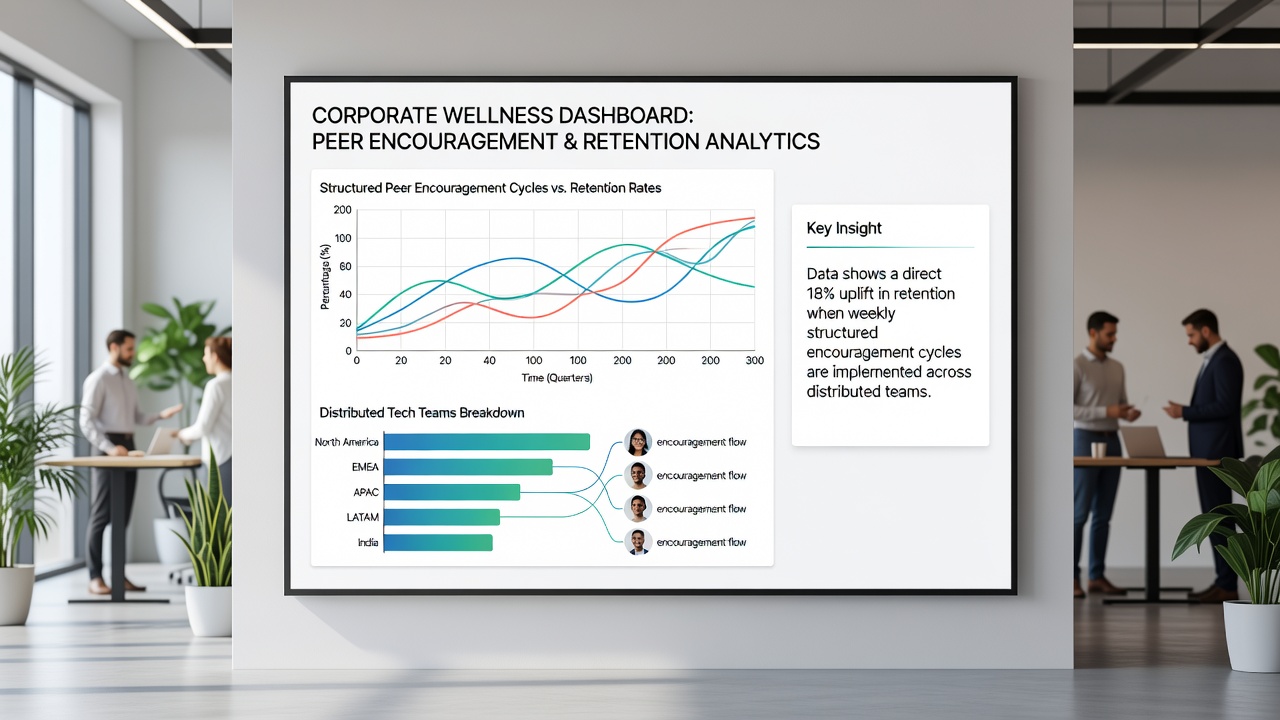
Wellness dashboards pull data from communication platforms, HR information systems, and employee feedback modules to overlay encouragement cycle metrics against retention figures, which include voluntary departure rates tracked monthly, and the systems generate visualizations that highlight patterns such as teams with cycle participation above 75 percent showing lower turnover compared to those below that threshold.
Research indicates that platforms like these process thousands of data points daily, and analysts at firms using the tools report correlations where each 10 percent increase in cycle engagement aligns with a 4 to 7 percent improvement in six-month retention, according to aggregated internal reports from multiple software companies operating in North America and Europe.
Observed Correlations in Distributed Tech Environments
Distributed tech teams, which often include engineers, product managers, and support staff working from locations in the United States, Canada, and the European Union, provide clear test cases because their retention data appears in public filings and industry surveys, while encouragement cycles run asynchronously through shared digital channels that dashboards monitor in real time.
Data shows that in October 2026 several large platforms released updated benchmarks revealing that groups completing at least three full encouragement cycles per quarter experienced an average retention rate of 89 percent over the following year, whereas comparable teams without structured cycles hovered near 78 percent, and these figures come from cross-referenced sources including employment statistics compiled by the U.S. Bureau of Labor Statistics and parallel datasets from Statistics Canada.

One case involved a mid-sized cloud services provider with 1,200 remote employees where dashboard alerts flagged declining cycle participation in two engineering squads, prompting targeted adjustments such as simplified prompt templates, after which retention in those squads rose by 11 percentage points within nine months, and observers note similar patterns across other firms that refined their cycle structures based on dashboard outputs.
Implementation Patterns Across Regions
Companies in the Asia-Pacific region have adopted similar dashboard setups, often integrating them with local compliance requirements for workplace well-being tracking, while European operations emphasize data privacy controls under existing regulations when logging encouragement interactions, and North American teams focus more on direct retention forecasting models that feed into annual planning cycles.
Turns out these regional variations produce consistent directional results, with higher cycle engagement tied to reduced voluntary exits, although the strength of the link varies by team size and role type, and industry reports from organizations such as the Society for Human Resource Management highlight that dashboard users adjust encouragement prompts quarterly to sustain participation.
Measurement Challenges and Adjustments
Tracking accuracy depends on consistent data input, because incomplete logging of cycle responses can skew correlation calculations, yet many platforms now incorporate automated reminders and API connections to minimize gaps, and analysts cross-check dashboard outputs against exit interview summaries to validate whether encouragement participation truly influences decisions to stay or leave.
Those who've studied the systems point out that external factors such as compensation changes or project deadlines can override cycle effects, so dashboards increasingly include control variables for these elements, allowing teams to isolate the contribution of peer encouragement structures more precisely over time.
Conclusion
Corporate wellness dashboards continue to supply detailed mappings of how structured peer encouragement cycles connect to retention rates in distributed tech teams, with ongoing data collection through October 2026 and beyond expected to refine these linkages further as more organizations standardize their tracking approaches and share anonymized benchmarks across borders.