Frankie Schwarz · 25 September 2026
How Transit Authorities Embed Kindness Prompts Into Commuter Apps to Track Reductions in Reported Anxiety
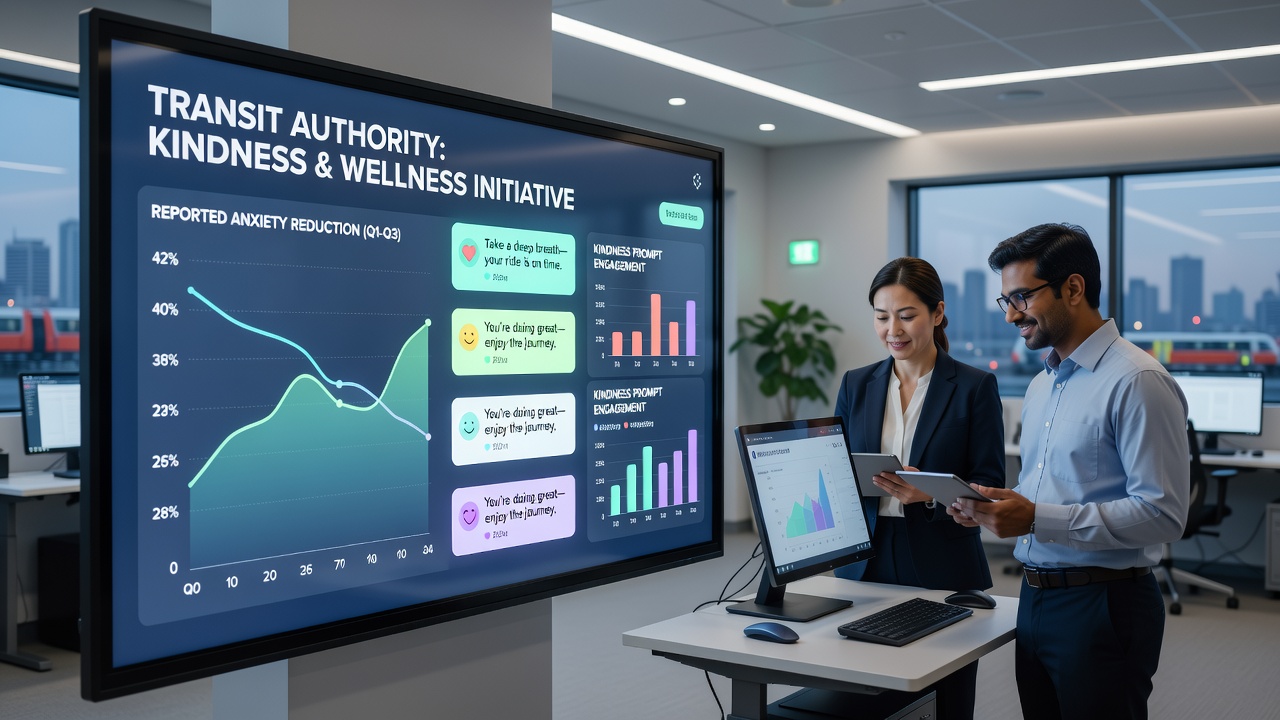
Transit authorities across multiple continents have begun integrating kindness prompts directly into commuter applications, creating structured opportunities for users to engage in brief positive actions while traveling and allowing systems to monitor shifts in self-reported anxiety levels over time. These features appear in apps managed by agencies in North America, Europe, and parts of Asia, where daily ridership data combines with optional wellness modules to generate aggregate reports on passenger mental health indicators.
Developers design the prompts as short, voluntary messages that appear during wait times or after ticket purchases, suggesting actions such as offering a seat, sharing route information with another rider, or sending a digital thank-you note through the app. When users complete these steps, the system records participation rates alongside anonymous anxiety surveys that riders can fill out at the start and end of their journeys. September 2026 marked the rollout of updated versions in several major networks, coinciding with new data dashboards released by the International Association of Public Transport that highlighted participation trends from the previous twelve months.
Implementation Across Different Transit Networks
Agencies handle the technical integration through partnerships with software firms that specialize in mobility platforms, embedding the kindness modules as optional toggles within existing ticketing and navigation interfaces. In one documented case, a Canadian metropolitan system linked its app to municipal health databases under strict privacy protocols, enabling researchers to cross-reference kindness activity logs with broader urban stress metrics collected through public health surveys. Similar approaches have emerged in Australian capital cities, where transport operators collaborated with university teams to test prompt timing algorithms that adjust based on peak-hour crowding data.
Users receive notifications only after opting into the wellness section, and the prompts rotate through a library of evidence-based suggestions drawn from psychological studies on prosocial behavior. Data collection occurs at the backend, where de-identified entries feed into dashboards that display city-wide averages rather than individual profiles. Observers note that this structure maintains compliance with regional data protection regulations while still yielding measurable datasets on anxiety fluctuations.
Data Collection and Anxiety Tracking Mechanisms
Each participating app includes a simple slider or emoji-based scale for riders to rate their current anxiety level before boarding and again upon arrival at their destination. When a user engages with a kindness prompt in between those two points, the system flags the session for comparison in aggregate reports. Researchers at institutions including the University of California and the European Transport Safety Council have analyzed these paired entries, finding consistent patterns where sessions that included prompt interaction showed lower average anxiety scores at journey end.
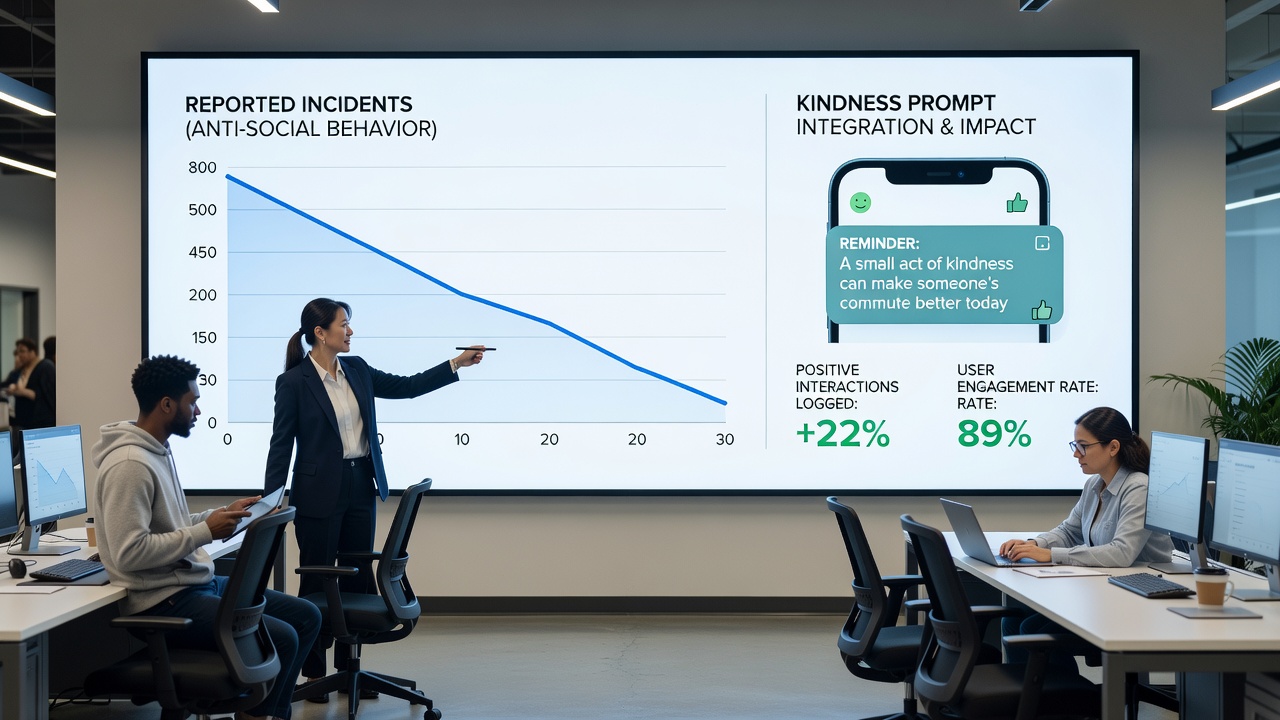
Reports released in September 2026 from the American Public Transportation Association indicated that networks incorporating these features recorded a measurable uptick in prompt completion rates during evening commutes, correlating with stabilized anxiety readings across sampled user groups. The tracking remains strictly anonymized, with no personal identifiers attached to the kindness logs or survey responses. Agencies publish quarterly summaries that transportation planners use to adjust service frequency or station amenities, treating the mental health indicators as one data layer among many operational metrics.
Geographic Variations and Pilot Outcomes
European operators have adapted the model to include multilingual prompt options, reflecting the diverse rider populations in cities such as Paris and Berlin. Asian transit systems, meanwhile, have focused on gamified elements where repeated kindness actions unlock small fare discounts or priority boarding tokens. A joint study conducted by transport researchers in Singapore and Melbourne tracked these variations over eighteen months, documenting how cultural context influences both participation volume and the magnitude of reported anxiety shifts.
Those who have examined the datasets emphasize that external factors such as weather disruptions or major events still exert stronger influence on daily anxiety averages than the prompts alone. Nevertheless, the consistent presence of kindness features across multiple regions has allowed comparative analysis that isolates the contribution of these interventions from broader urban variables. Authorities continue to refine the prompt libraries based on user feedback collected through in-app surveys, ensuring the suggestions remain relevant to local commuting realities.
Conclusion
Transit authorities continue to expand these kindness prompt systems as part of broader efforts to incorporate passenger well-being data into operational planning. The combination of voluntary prosocial actions with standardized anxiety tracking provides agencies with new streams of information that complement traditional ridership and satisfaction metrics. Ongoing refinements in September 2026 and beyond will likely build on the patterns already visible in current datasets, supporting further integration of mental health considerations into public transportation design.